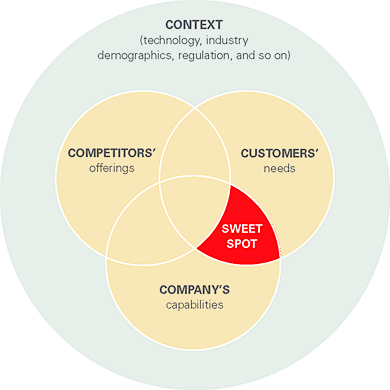
You need a simple picture that demonstrates the thousand words about your value. You have three goals: attention, comprehension, and retention.
Helping create yours is one of our specialties. So, for our next brainstorm session, share this post, using: rebrand.ly/Your_Story_Map
Below are several visuals to inspire your own Business Model Map. This is a single image of the process that happens when you bring value to your customers. Call it an Infographic... or an Ecosystem Diagram ... or a Usage Data Flow Chart ... or whatever - just keep at it until yours is simple and informative.
Remember one important goal - - make it interesting and helpful enough for people to want to share it.
The key to an infographic is the "info" part... it's NOT about big fonts, cool pictures and design ... Use the art to dramatize a point and demonstrate a connection, process, comparison, differentiation, proportion, ratio, etc.
Let's discuss which of the below formats suit you ...
Contact us... we will bring paper, pens, whiteboards, chalk, ... back of napkins...
For more inspiration, read this from Kissmetrics and watch this video from the infographic portal www.Visual.ly
Lastly, Think Brilliant created a clever parody of infographics ... using one:


.jpg)


